Now that you understand how experiences are created, and how they impact the performance of an organization, it’s time to look more closely at the information that helps you understand an experience.
In Experience Management, you will predominantly work with two kinds of data: Experience Data (X-data) and Operational Data, (O-data). This section defines each type, and the next section addresses how they work together to generate insights.
In this article:
-
Experience Data (X-Data)
-
Operational Data (O-Data)
This is data that is collected from stakeholders to understand experiences from a human perspective. It's the data of how people think, feel, and behave.
This is most commonly collected through surveys but can also come from other sources, such as insights gleaned from analyzing recorded speech, analyzing the text of contact center interactions, the sentiment expressed in social media, online review posts, stakeholder interviews, focus groups, and other ethnographic techniques.
There are 6 types of X-Data:
-
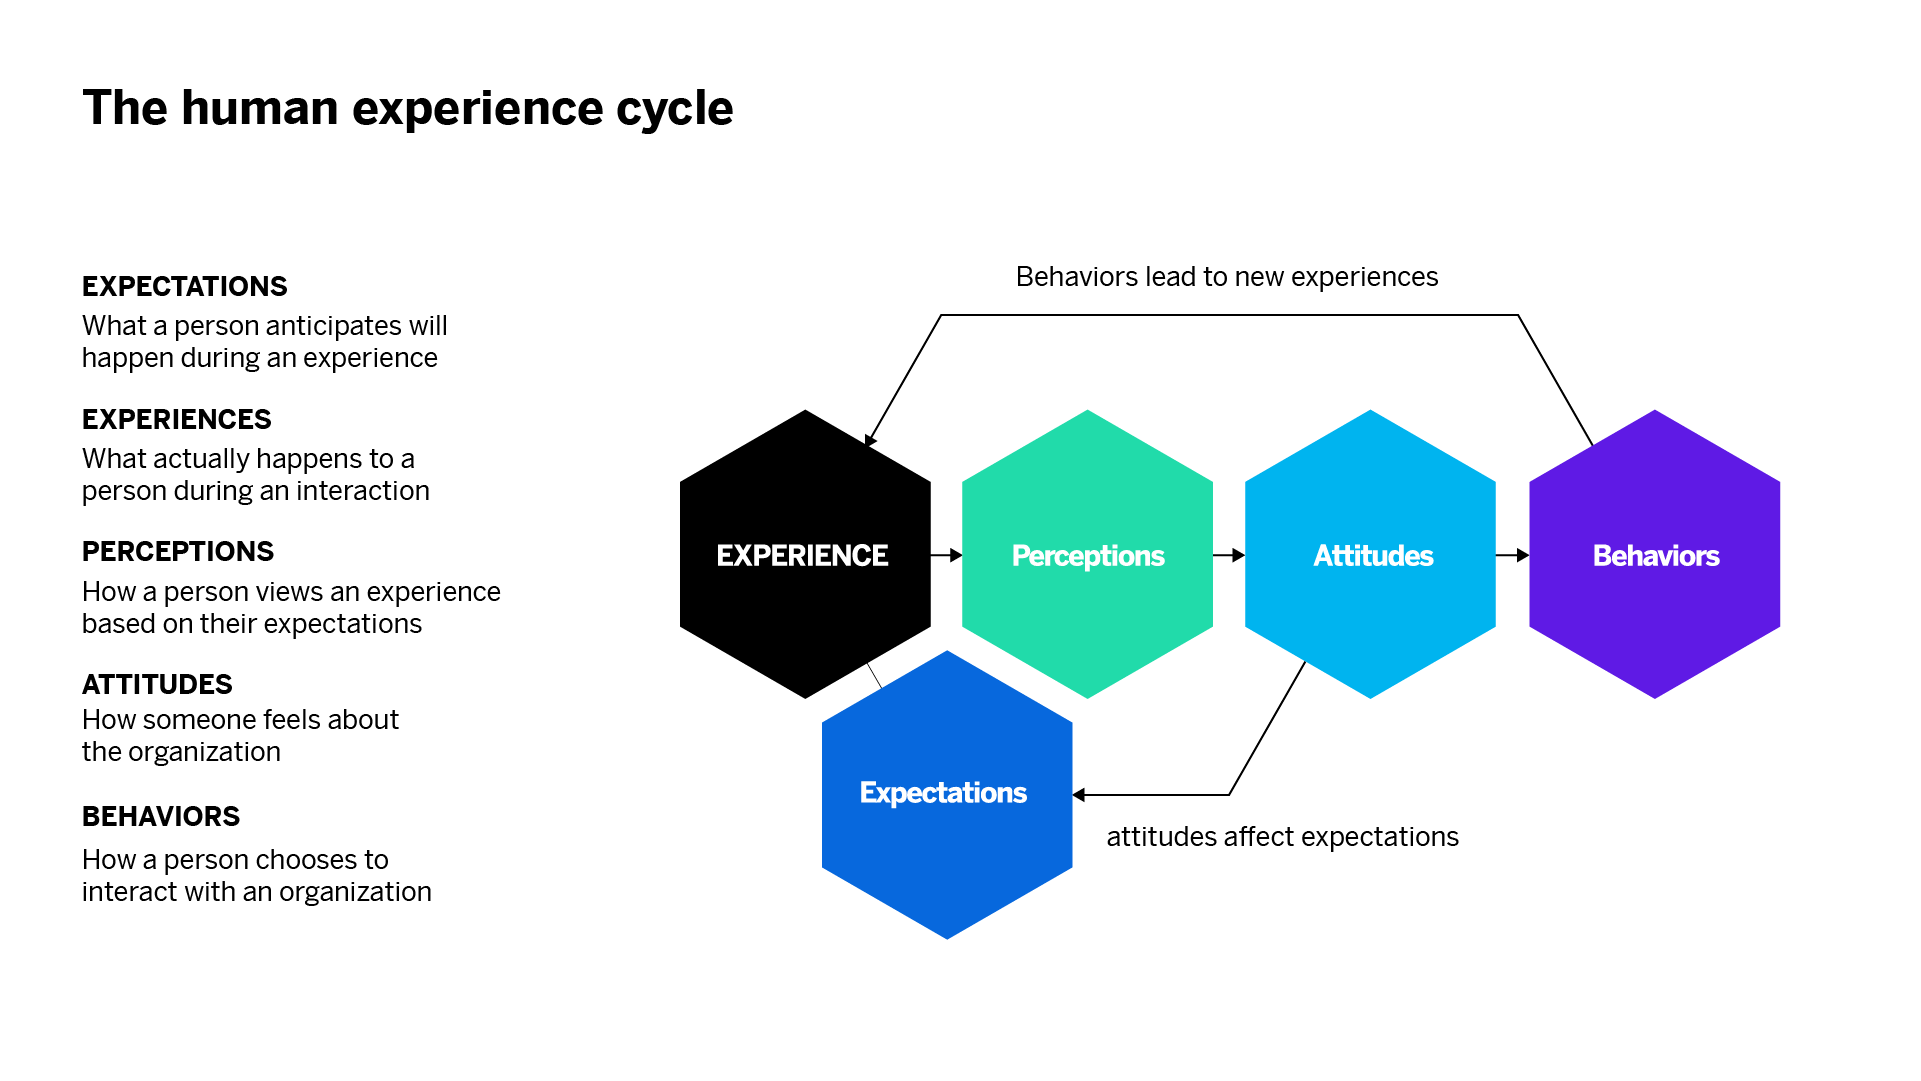
Experience Expectations- How people think and feel about a future interaction with an organization, which can be collected on a regular cycle or periodically (e.g. whether a customer expects a product to be hard to use or believes they can accomplish a service interaction online).
-
Interaction Perceptions- How people think or feel about a specific interaction, which can be tracked continuously or periodically (e.g. feedback after an online purchase or after an employee training course).
-
Journey Perceptions- How people think or feel about a collection of activities around a goal, which can be tracked continuously or periodically (e.g. feedback after an airline customer finishes a trip or after an employee completes their onboarding).
-
Relationship Attitudes- How people feel about relationships with other people in their organization (e.g. managers, peers, leaders). This also includes how people feel about their relationship with an organization overall, including plans for future interactions, which can be tracked on a regular cycle or periodically (e.g. Customer NPS, Customer Sentiment, Employee Engagement, or Brand Tracking studies).
-
Ad-Hoc Diagnostics- How people think or feel about a problem or opportunity, which is collected as needed based on other findings (e.g. pulse employee survey about a leadership issue or qualitative study into why a brand message didn’t work).
-
Choice Preferences- How people would rank different alternatives, which is collected periodically (e.g. product feature selection or employee benefits optimization).
As you can see, X-Data is concerned with the human elements of a business's activities.
This is the data that an organization collects as part of the normal course of business—the data of what happened, when, where, how much, and who by. When the need arises to measure specific experiences, XM Professionals can leverage O-data to contextualize and enrich the X-data.
There are innumerable types of O-data. Some common examples include:
|
Demographic Data |
Interaction/ Transactional History |
Identifying Information |
|---|---|---|
|
Citizen registered state Gender Employee tenure State / Region / Country Branch name / location Number of children |
Application date Products owned Website cookie exposure Call history Interaction ID Training date |
Employee name / ID Customer segment Account number Mobile number Loyalty status |
Optional Additional Learning: You can read more details about X and O data in this article from the XM Institute.
O-data tells you what happened. X-data tells you why it’s happening.
In the normal course of business, you will collect a lot of Operational Data that can tell you about what happened, but it can illustrate only that.
To explain why certain things are happening you need to measure the human element, the Experience Data. What the human stakeholders thought, felt, and expected.
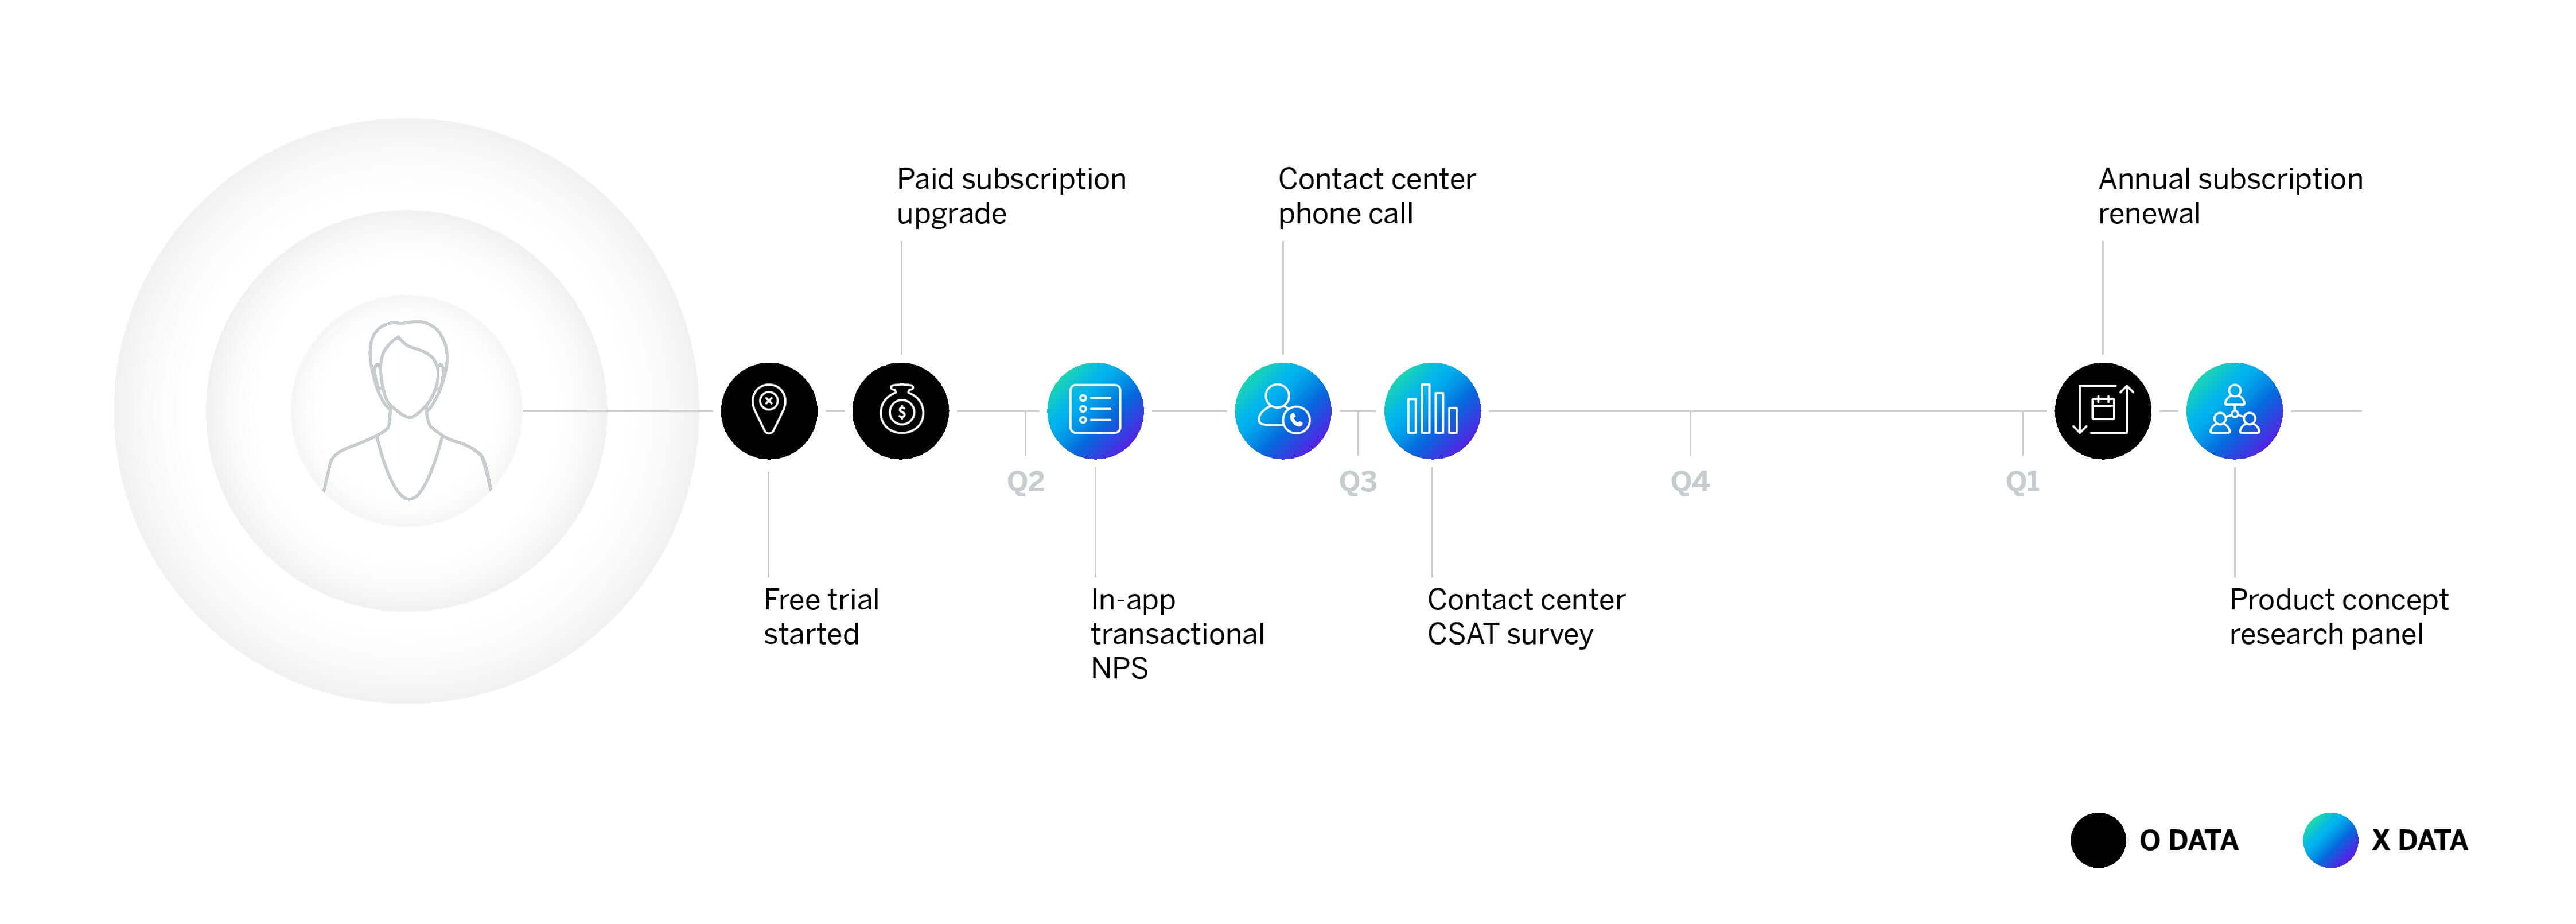
See for example the below illustration of a customer of a paid music subscription service. Along their journey, they interact with the business, creating opportunities to ask the customer why they upgraded, how the process aligned to expectations, and if the service was delivered.
To unlock the true potential of connecting Experience and Operational Data together you need to learn the ways they can be analyzed to draw insight. In the next section, you will be taken through an example of applying X and O Data together.