Survey respondents are busy and do not have a lot of time to spare. As the survey builder, you should respect their time and create surveys that are not only quick but also easy for them to complete.
Here are recommendations to create a survey that balances simplicity and data quality.
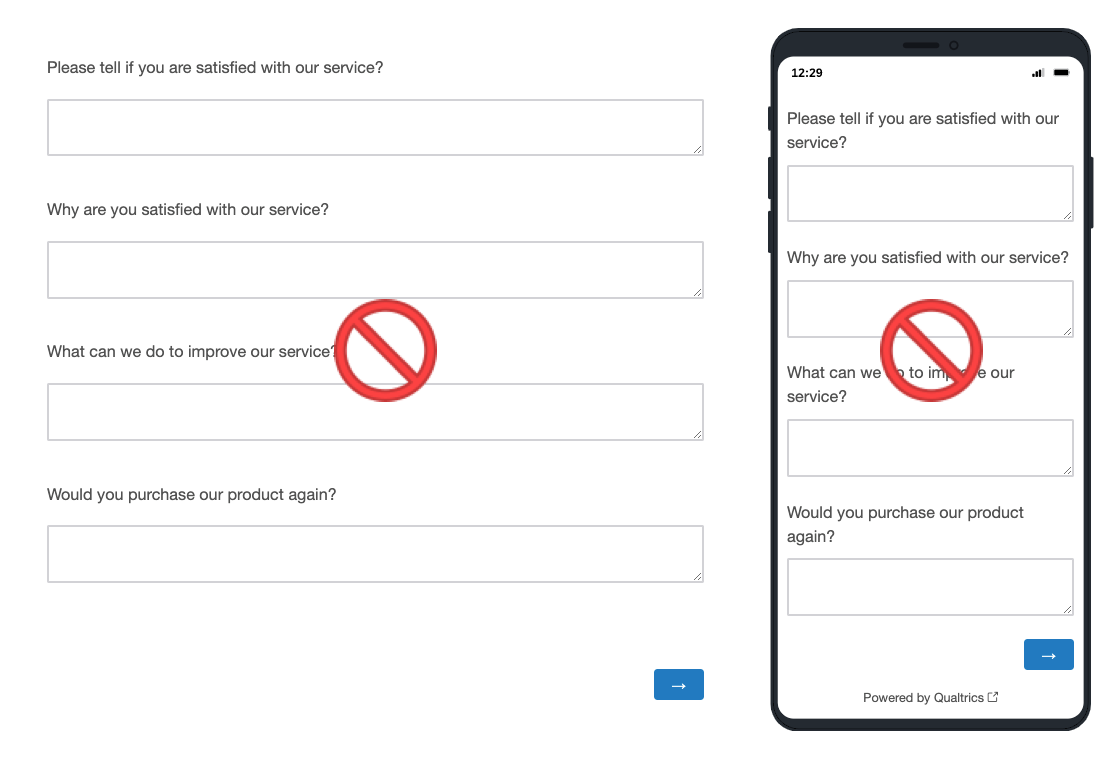
Limit Open-Ended Questions.
A survey should consist mostly of questions with answer choices, such as multiple-choice, scale, and grid questions. These questions create the structure for your analysis and are intuitive for respondents to understand and answer, producing better data quality.
Open text entry questions ask customers to provide feedback in their own words. From a survey perspective, this requires a high level of effort for a respondent and can result in drop-outs and incomplete responses.
|
![[Tip]](../css/image/tip.png)
|
Tip |
|---|---|
|
It is recommended to limit the number of text entry questions to one and two (unless absolutely critical to the survey outcome, or if the survey is part of a Qualitative study). |
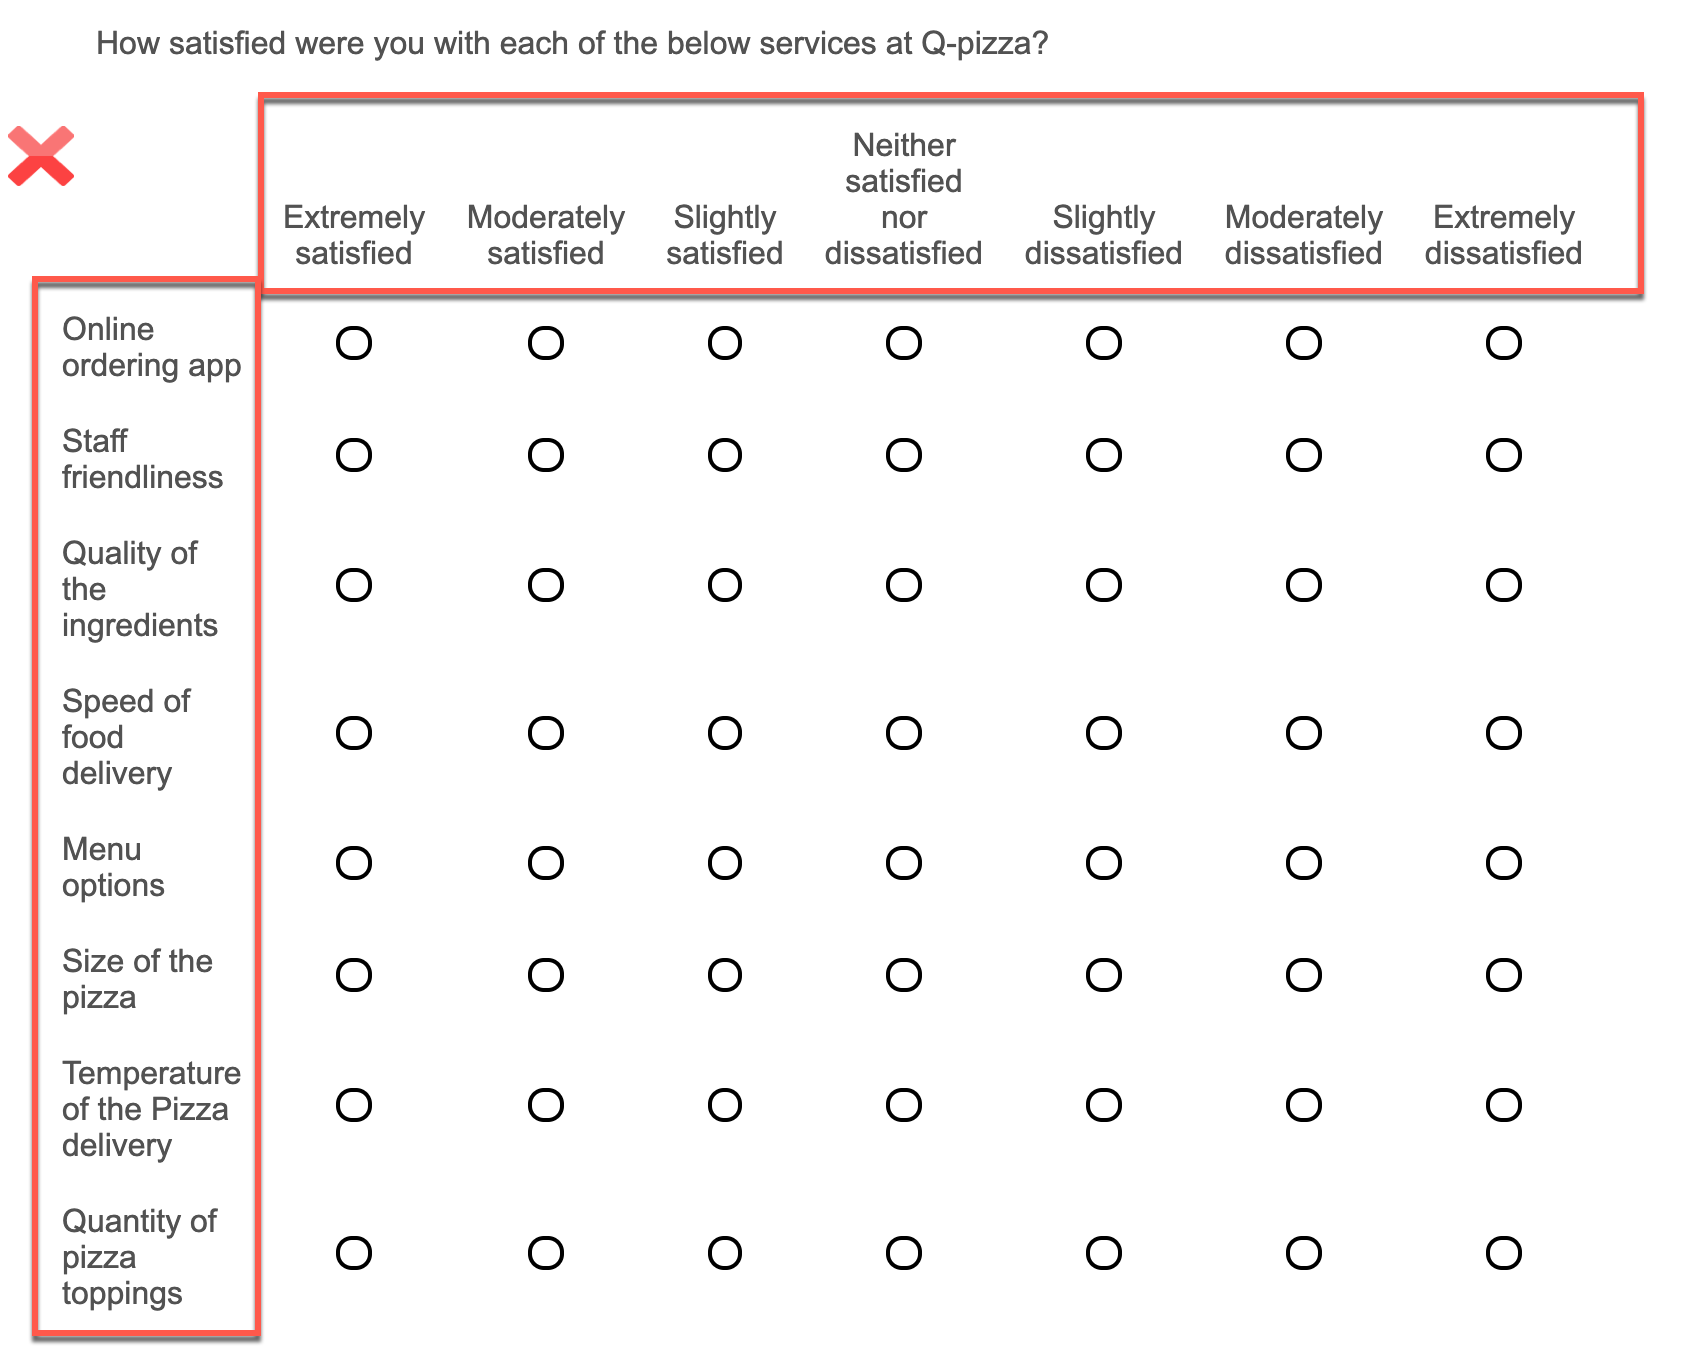
Use Grids with Caution:
Grids are appealing to a survey creator— they are easy to set up, have a logical structure, and are believed to be faster to answer for the respondent. However, many survey builders overlook that these questions require more effort for the respondent to understand and answer, and are more complex for analysis purposes.
As grid questions become more complete, respondents’ cognitive burden increases. They react by taking shortcuts in answering (e.g. straight-line answers), resulting in lower data quality (e.g. smaller differentiation of answers) for your business decisions to be made from.
-
Bad Practice: long statement lists, and/or long scales (unless critical to the data outcome).
-
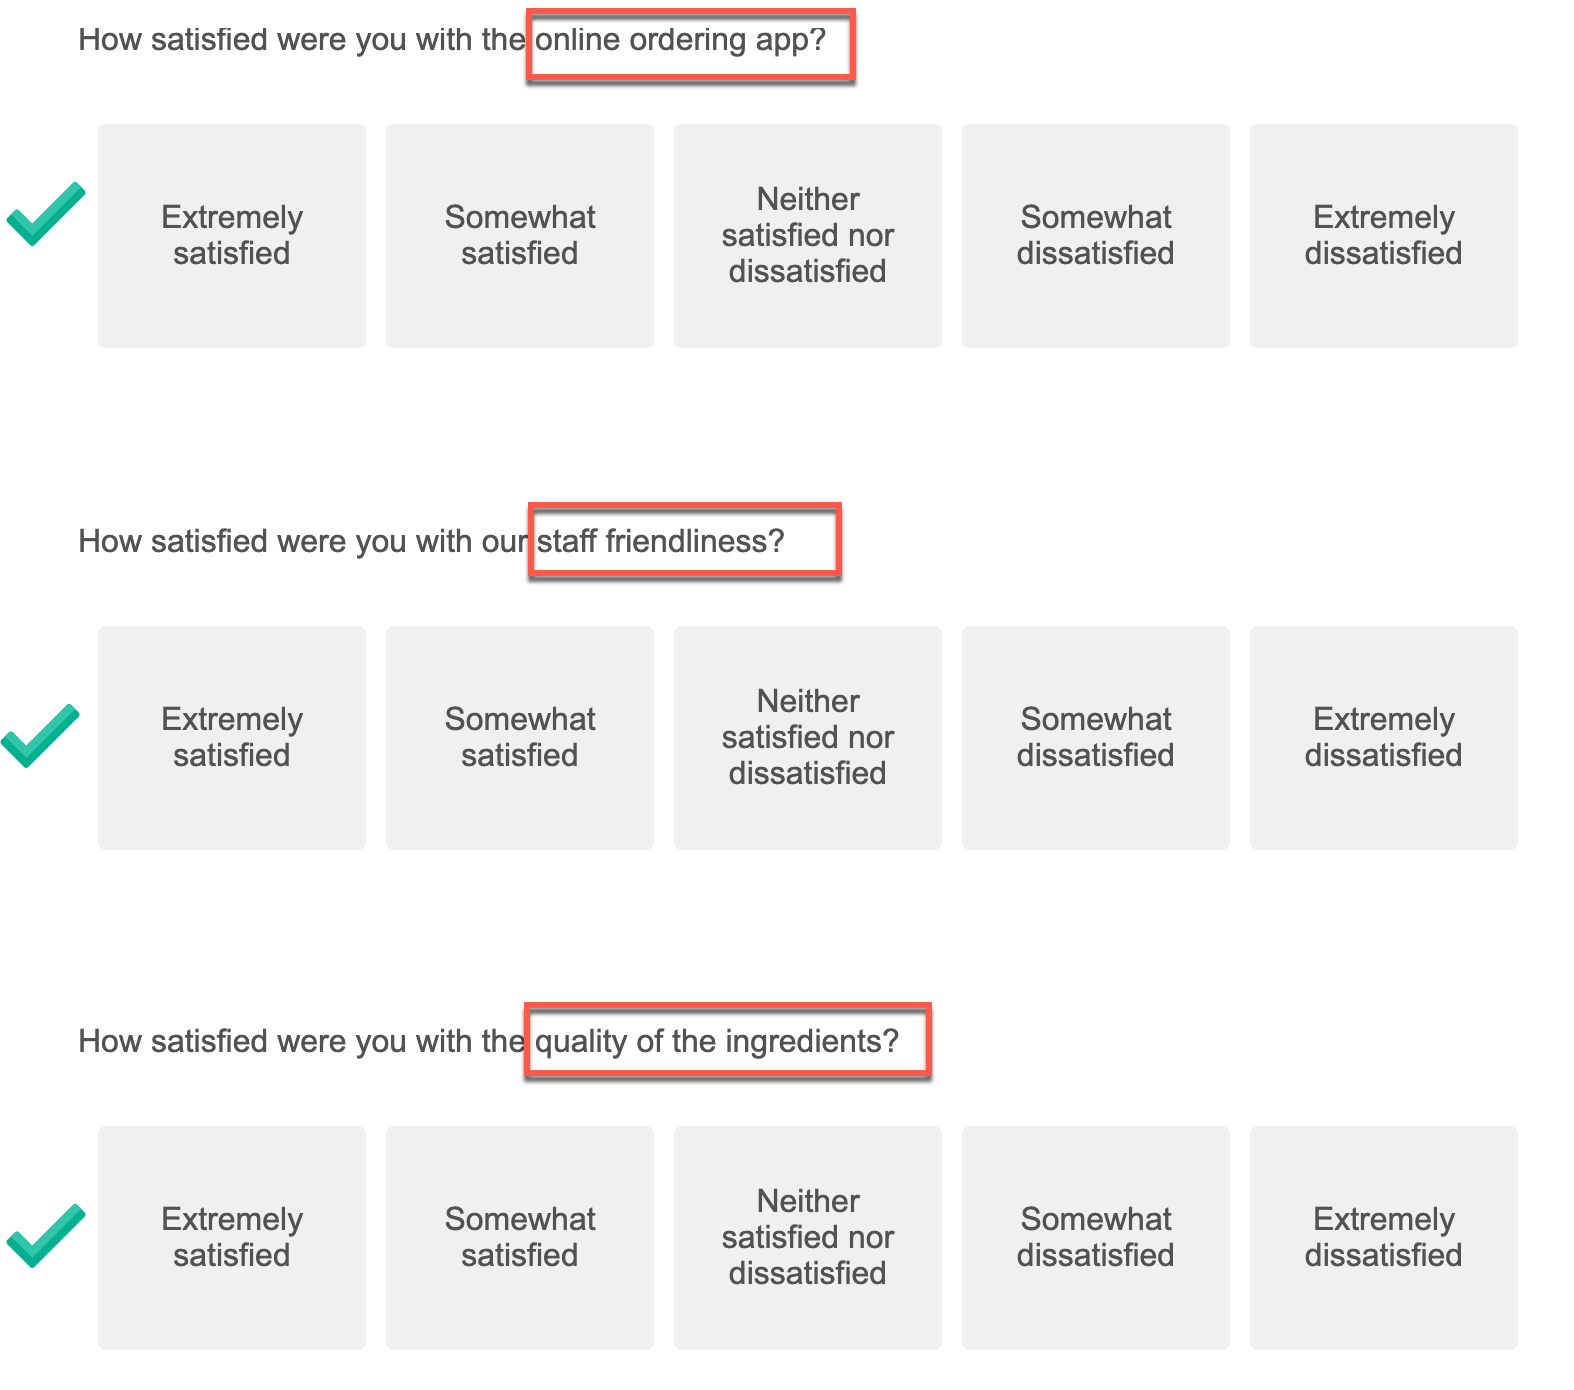
Good Practice: Use 5 point scales, limit statements in the grid; and wherever possible use single statement rating questions instead of grids (see below).
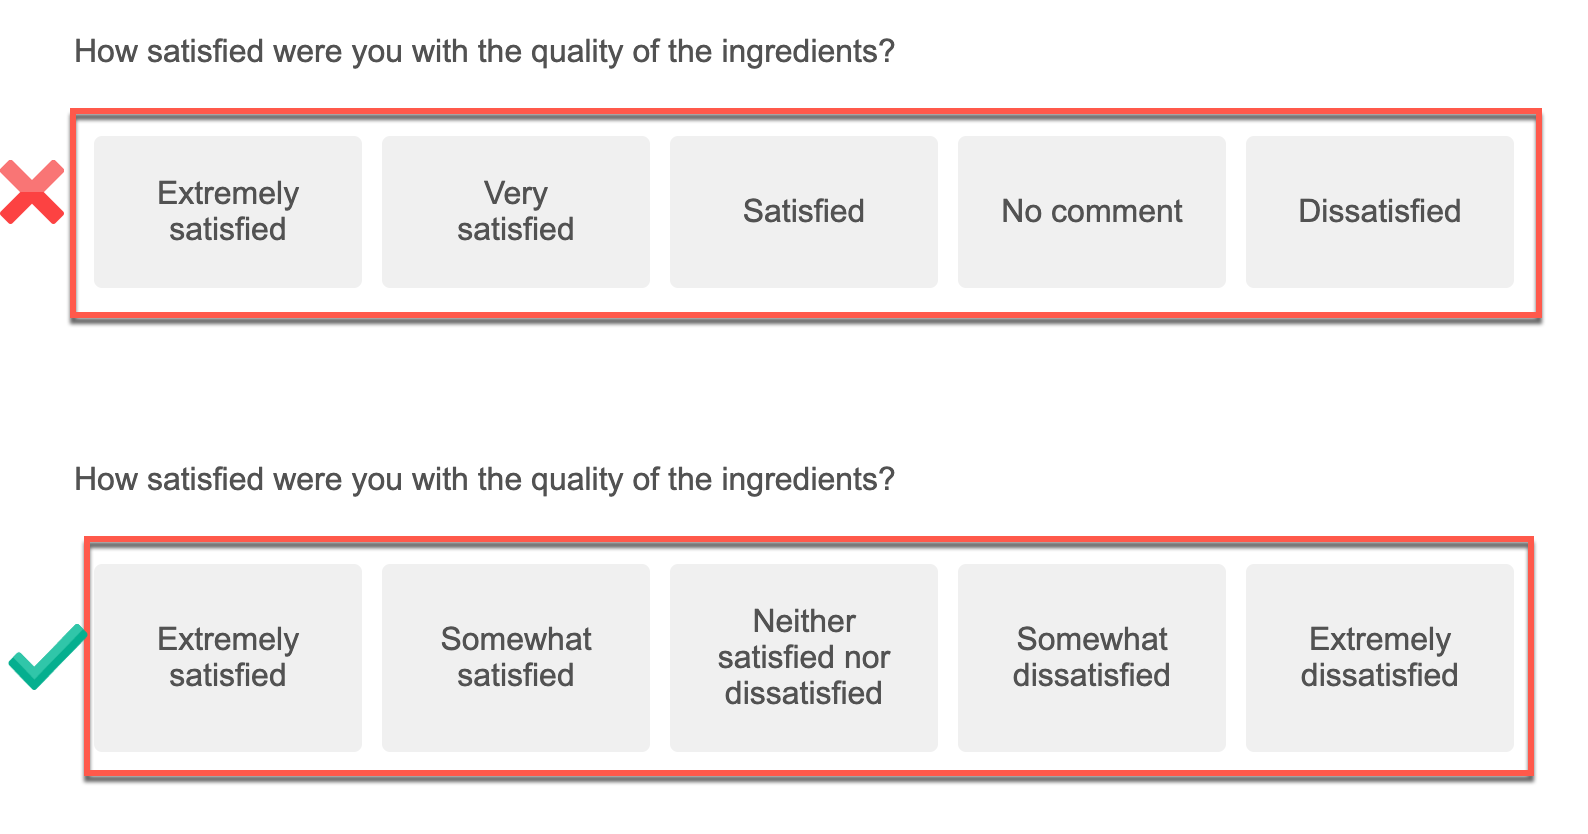
Designing Scale Points:
Response scales capture the direction and intensity of attitudes, providing rich data. There are two main considerations:
-
Scales need to be balanced: Questions with scale answers should have a midpoint that is neutral, with an equal number of positive and negative choices on either side.
-
Keep scale length short wherever possible: Common choices include 5, 7, and 11 point scales. When in doubt, use a 5 point scale, which gives you the direction and intensity of opinion, isn't visually challenging for the respondent, and is efficient for analysis purposes.